Like Blender, QGIS is one of the wonders of the open-source world. It’s an incredibly powerful and versatile tool for working with geospatial data, and it’s completely free. There’s plenty of tutorials to be found online, the aim here is to collect the most relevant information for track building.
- Understanding coordinate systems
- Layers
- Processing toolbox
- Plugins
- WMS sources
- Exporting and obtaining satellite imagery
- Preparing the lidar data
- Thinning point clouds by distance from the road
- Simulating visibility from the road
1. Understanding coordinate systems
Map projections try to portray the surface of (a portion of) the earth on a flat piece of paper or computer screen. Or put another way, map projections try to transform the earth from its spherical shape (3D) to a planar shape (2D).
A coordinate reference system (CRS) then defines how the two-dimensional, projected map in your GIS relates to real places on earth. The decision of which map projection and CRS to use depends on the regional extent of the area you want to work in, on the analysis you want to do, but especially on the availability of data.
More information in the on coordinate systems in the QGIS documentation.
WGS84 is the most commonly used spherical coordinate system (think of GPS coordindates). However, for 3D applications we need to switch to a projected coordinate system where the x, y, z coordinates are located on linear axis. In this system the 0, 0, 0 coordinate is located at the center of the chosen area.
It’s crucial to be aware of the coordinate system in which your data is defined, usually indicated by an EPSG code. To ensure that your most significant data is accurately represented it’s recommended to set the ‘project’ CRS in QGIS (located at the bottom right) to the same CRS as your principal data. The EPSG code also specifies the unit of measurement for the data, which can be either meters or feet.
Translations between coordinate systems are possible.
2. Layers
Information is organized in layers, located in the lower left pane. By dragging layers up or down you can choose which layer is displayed on top, or simply enable/disable layer visibility. The layers can show data both from local files and streamed from online sources (for instance WMS = web map services).
For track creation the most frequently used data types are:
- Raster: typically
- Digital Elevation Models (DEMs) where each pixel value represents an elevation instead of a color. Elevation models can come in the form of a Digital Terrain Model (DTM) = ground only, or a Digital Surface Model (DSM) including objects like buildings and trees.
- Orthopictures; aerial or satellite photographs. “True” orthopictures have been processed in such a way that no perspective can be seen; any object is pictured from straight above (which is not 100% the case for most services).
- Vector: lines, points, polygons. Shapefile is a popular file format for vector data. In case of problems with Shapefiles, convert to Geopackage which is a more modern/robust format.
- Point clouds: when adding point clouds QGIS will automatically convert them to the .copc.laz format, which is 100% compatible with the (compressed) .laz format but structured in such a way to allow streaming & rendering without loading the entire file into memory. In the past point cloud support in QGIS was very limited, but with the introduction of PDAL wrench in version 3.32 things are moving forward. Visualizing point clouds in 3D within QGIS is possible but still more convenient in CloudCompare.
- GPX: contains tracks made up of a series of GPS coordinates, popular for hiking & cycling. As GPS coordinates are in the spherical WGS84 system, they have to be exported into in a projected CRS (preferably in Geopackage format) for further usage. GPX tracks can be created in QGIS but it’s much easier to create them in gpx.studio or judise.nl and import.
It’s important to verify the CRS for each layer (right-click on the layer name); some data will contain layer information, some will not, sometimes a layer will need a transformation. By dragging layers up or down (or setting transparency) you’ll quickly notice if they align. By right-clicking a layer it’s possible to make a layer (semi)transparent, which can help in interpreting.
Operations can combine layers, for instance creating a polygon in a vector layer to cut out a section of a raster layer or point cloud.
3. Processing toolbox
The right pane of the screens contains the processing toolbox, this pane can be enabled or disabled via the gear icon in the menu. All sorts of tools for processing data can be found here – use the search box on top.
4. Plugins
QGIS is fully customizable and extendable and some 2000 plugins adding functionality are available. Most can be found via the built-in plugin manager, some are downloaded & added from ZIP file. Plugins can appear on the taskbar, in the menu and/or in the processing toolbox.
A very convenient one is QuickMapServices, providing quick access to all sorts of online map services like Google, Bing, OpenStreetmap,… An icon for searching & adding maps will appear in the taskbar.
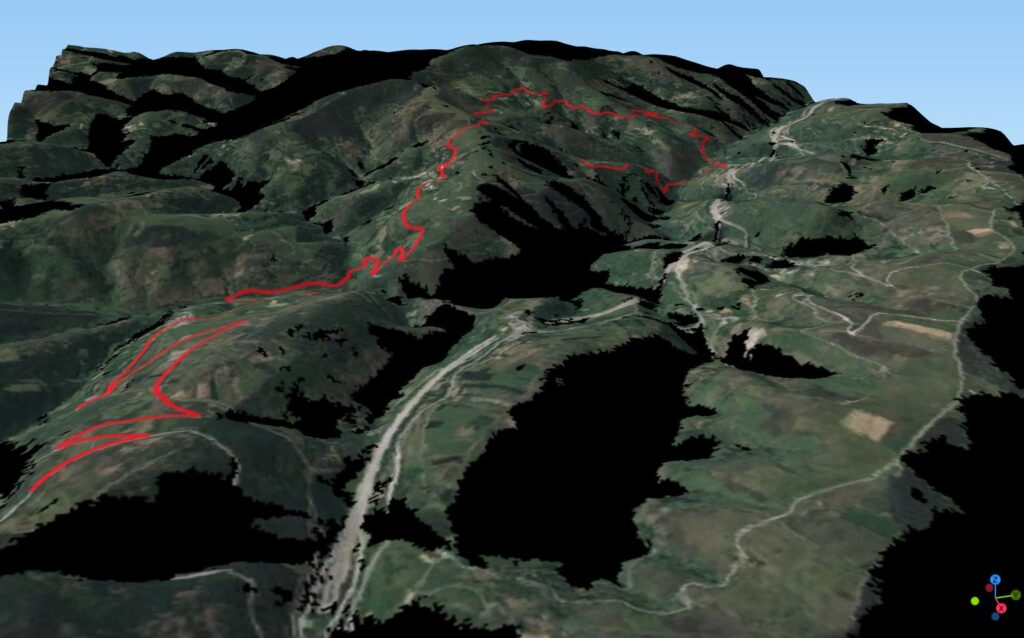
For visualizing DEM data in 3D the Qgis2threejs plugin is very nice. Lidar data first has to be converted in to a rasterized Digital Elevation Model (DEM).
5. WMS sources
Most governmental agencies offer a web interface for accessing GIS data, but also WMS services which allow streaming data straight into QGIS. Once a WMS service is added in the Data Source Manager you can very quickly add it into a project.
- Go to Layer -> Data Source Manager > WMS/WMTS
- Add New, give it a name, enter URL, save
- Connect => Accessible data layers are shown
- Now you can add the layers from the browser pane (top left)
As an example, hi-res orthopics for Belgium:
- https://geo.api.vlaanderen.be/OGW/wms (Layer: OGWRGB13_15VL, native projection: EPSG 31370)
- https://geoservices.wallonie.be/arcgis/services/IMAGERIE/ORTHO_2021/MapServer/WMSServer (native projection: EPSG 8370)
France: https://data.geopf.fr/wms-r/wms (Layer: HR.ORTHOIMAGERY.ORTHOPHOTOS, native projection: EPSG 2154)
Spain: https://www.ign.es/wms-inspire/pnoa-ma (Layer: OI.OrthoimageCoverage, native projection: EPSG 25828/2062/4083)
6. Exporting and obtaining satellite imagery
Exporting data layers in QGIS is also the way to convert or transform data, like converting from Shapefile to Geopackage, or transforming into another coordinate system. An example, to export data from online map services like WMS or Bing/Google imagery:
- Install the QuickMapServices (QMS) plugin
- Set project CRS the same as the lidar data (bottom right of the screen), add lidar data
- Search QMS for Bing aerial, Google satellite,… or add locally available hi-res imagery via WMS. Check if it aligns properly with the lidar.
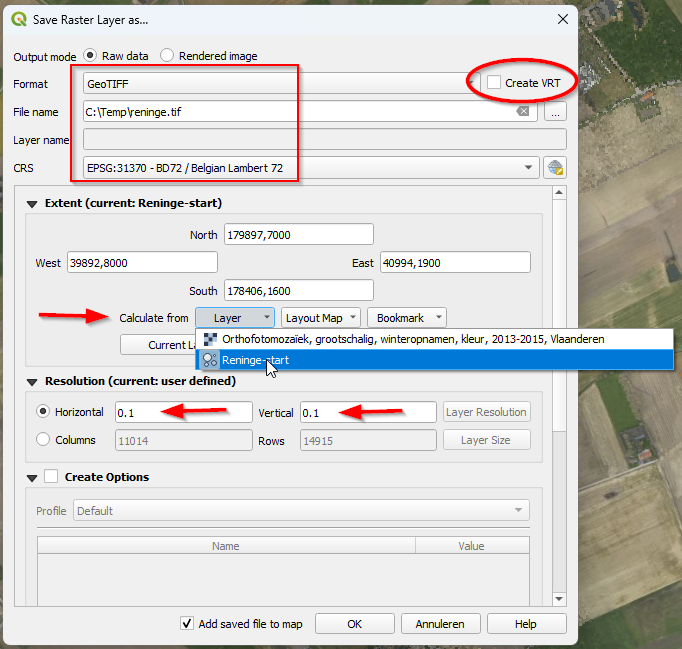
- Right-click the imagery layer and choose Export -> Save as…
- Keep GeoTIFF, de-select ‘Create VRT’
- Choose target folder & file name
- CRS: verify it’s set correctly!
- Extent: Calculate from layer > select lidar layer
- Resolution: set in meters (for instance 0.1 = 10cm if used CRS is defined in meters). Of course setting a resolution as high as 10x10cm will create a huge file.
The image will be downloaded, saved & added as a new layer, and can now be used for instance for coloring the point cloud (see PDAL)
For texturing it can be useful to divide the image in tiles:
- Right-click exported image layer > properties, find width & height under ‘Information from provider’ (to determine tile dimensions)
- Right-click the exported image layer and choose Export -> Save as…
- Select ‘Create VRT’
- Set a target directory
- Leave the default layer resolution
- VRT Max colums & rows: set horizontal & vertical tile size (in meters; in example 500x500m)
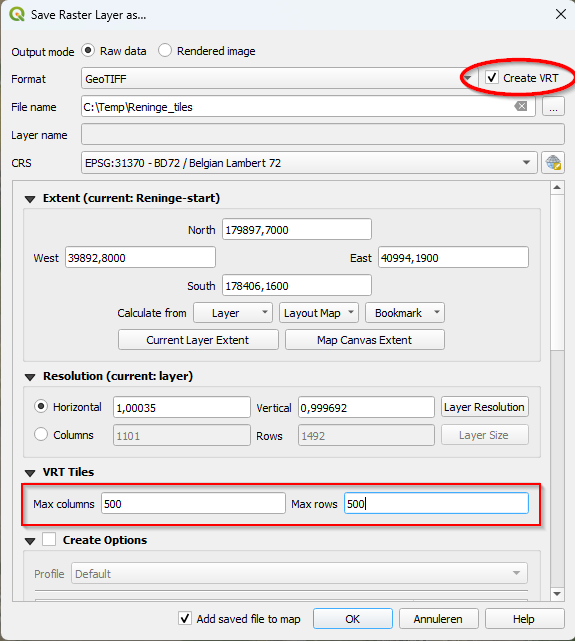
The tiff wil be split in tiles & saved, and added as a single layer (virtual raster)
7. Preparing the lidar data
Aerial lidar data is delivered in tiles.
- Check if the data is grounded: this can easily be seen by adding a tile in QGIS. If the tile contains only unclassified data it has to be grounded, this can be done using open-source tools but this process is a bit tricky at the time of writing. Default class for ground points = 2. Some data may have roads and/or bridge decks assigned to separate classes (11,17), these points should of course be retained for further processing.
- Add an underlying map using QuickMapServices to verify the coordinate system, the lidar data should align with the map.
- Merge the tiles: the fastest way is using command line tools but can be done in QQIS GUI: in the processing toolbox you can find “Merge” under “Point cloud data management”. Add the directory containing the tiles to “input layers”, under “Filter expression” put “Classification = 2 or Classification = 11 or Classification = 17” to retain only the ground, road and bridge points. Saving directly as a .copc.laz file is not possible at the moment; save as .laz, conversion to .copc.laz will happen automatically afterwards.
- Colorizing the data may make it easier to handle, but best after thinning as this will be much faster.
8. Thinning point clouds by distance from the road
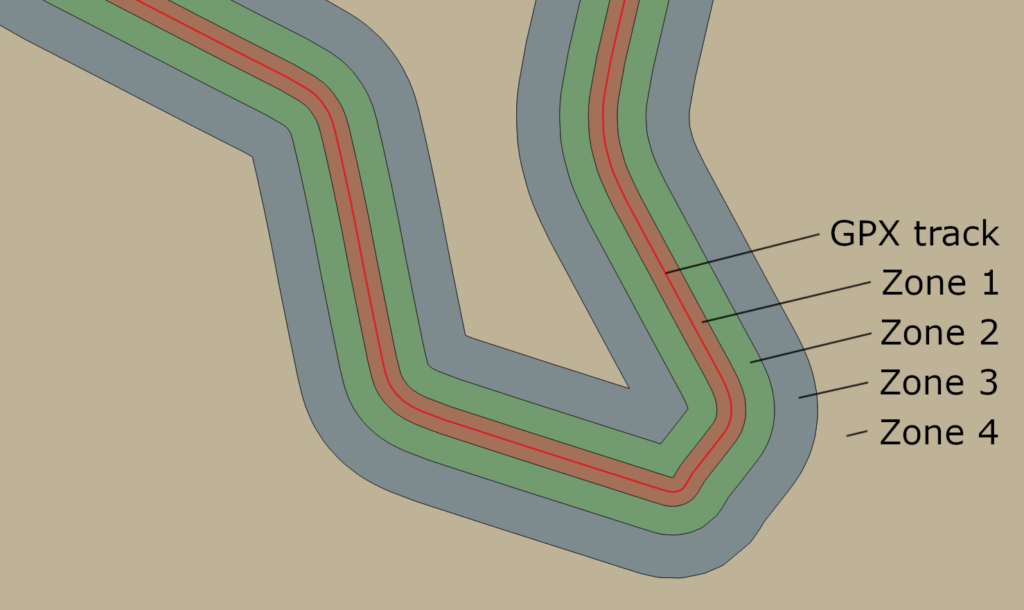
By using a GPX file to define the road position and applying buffering we can split lidar data into zones and gradually reduce points density based on the distance from the road. This way it’s possible to generate a detailed base terrain mesh that can be handled without a supercomputer. Do check whether the unit of measurement for the data is set in meters or feet, and adjust values accordingly.
- Prepare the lidar data and load into QGIS; make sure
- Only ground points are used, check if separate road or bridge deck classes are present (classes 11&17)
- Correct CRS is applied to the project
- Prepare the GPX file:
- gpx.studio is a great tool, make the GPX 100m longer than the stage start/stop positions
- Load the file in QGIS and export/add as a Geopackage file (.gpkg) in the correct CRS
- Check if the GPX nicely follows the road in the lidar data. Depending on the quality of the map used for GPX generation the track may deviate a bit in places. In this case set the central zone (max resolution) a few meters wider.
- Create contour buffers at chosen distances: lets say at 10, 30 and 60 meters
- Vector > Geoprocessing Tools > Buffer: select the track Geopackage as input layer, set distance (from the center line)
- Save as Geopackage, name the layer correspondingly for instance “Contour 10m” (road-covering zone will be 20m wide)
- Switch back to ‘parameters’ tab to create the next one
- Check if the road is completely covered by Zone 1
- Create a polygon squaring the entire map area:
- Vector > Research Tools > Extract Layer Extent, save as “Contour Map”
- Now the splitting zones are defined by cutting the smaller zones out of the larger:
- Use Vector > Geoprocessing Tools > Difference
- Set “Contour Map” as input layer, “Contour 60m” as overlay, save as Zone 4
- Set “Contour 60m” as input layer, “Contour 30m” as overlay, save as Zone 3
- Set “Contour 30m” as input layer, “Contour 10m” as overlay, save as Zone 2
- Contour 10m can be renamed to Zone 1
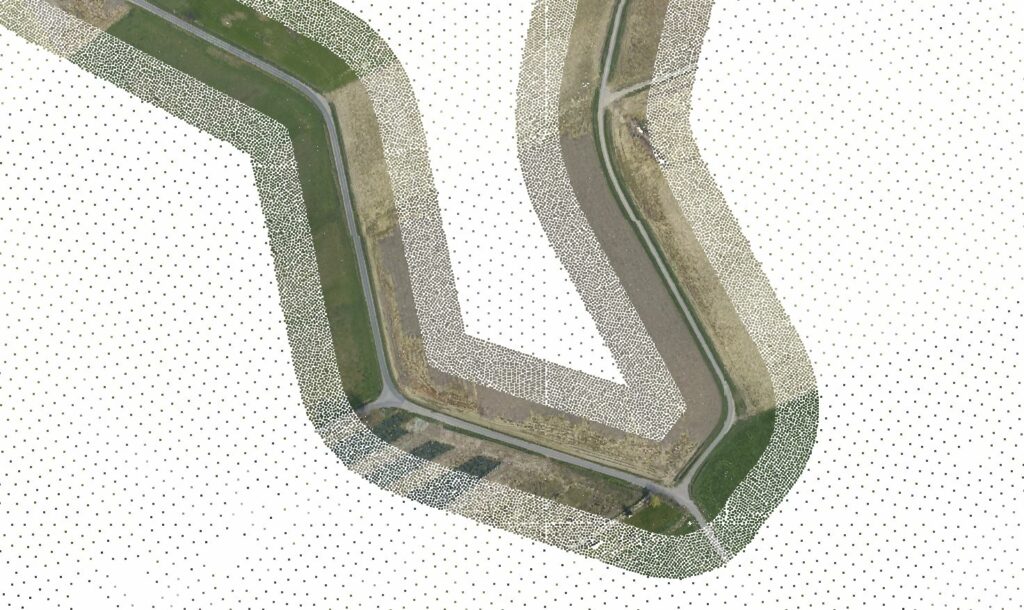
- Clip out zones 1, 2 and 3 from the lidar data using the Clip tool in the processing toolbox. As we’ll keep the original resolution for Zone 1 this layer can be renamed to Zone 1 – finished.
- Apply thinning to zones 2 and 3 using “Thin (by sampling radius)” from the processing toolbox. Set radius to 1 resp. 2 as proposed in table below. Name the output layers Zone 2 – finished resp. Zone 3 – finished.
- Normally zone 4 will be the largest by far; as such it’s faster to first thin the complete map, then clip out zone 4. This is because after clipping the resulting file has to be re-indexed. Thus, apply thinning with radius 10 to the complete map, save as Complete map – thinned. Then clip this layer using Zone 4 as overlay, save as Zone 4 – finished.
- Following values can be used as a starting point, in meters:
| Zone | Description | distance | density in ppm² | sampling radius |
| 1 | road/side; max density | 10 | original | n/a |
| 2 | high density | 30 | 1 | 1 |
| 3 | medium density | 60 | 0.25 | 2 |
| 4 | low density | ~ | 0.01 | 10 |
The 4 resulting zones can now be merged. It’s of course possible to use more or less zones, and other densities. For colorizing: download a low-res orthopic on map boundaries, and a hi-res on Zone 2 or 3 boundaries. Then colorize 2x: first using the low-res, then using the (smaller) hi-res.
Kudos to @nogoyaqb2 for assistance in integrating this workflow into QGIS
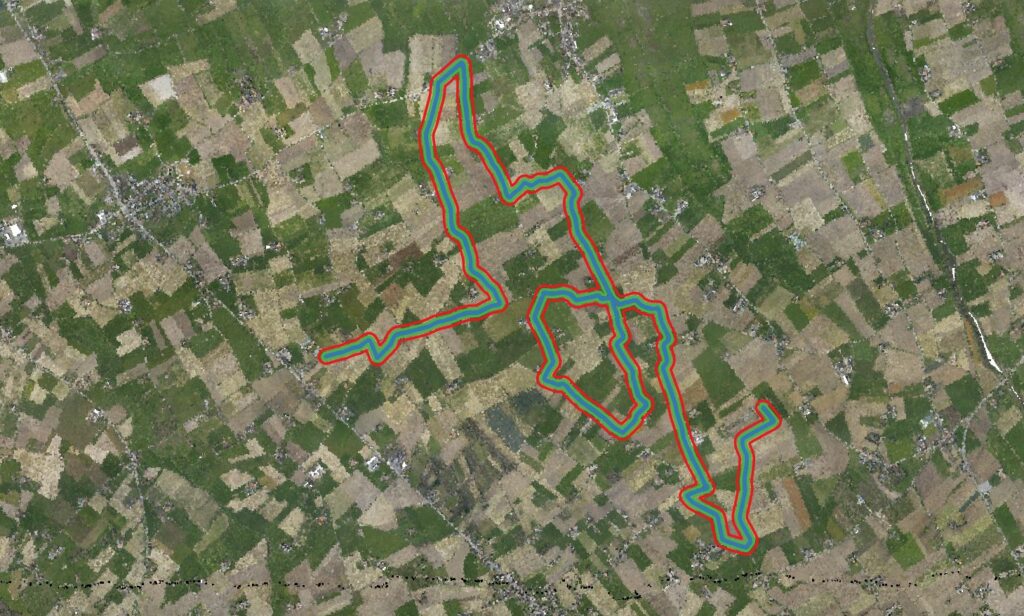
9. Simulating visibility from the road
When creating a track in mountaineous terrain it can be interesting to know which areas on the map will be visible from the road or not, so priorities can be set in texturizing or populating terrain or simply cutting off the map. QGIS can simulate this with the help of 2 plugins: QChainage and Visibility Analysis. The first plugin is used to convert a GPX file into a string of points, the second will convert the points into (height adjusted) viewpoints and calculate visibility from each point. In any case it’s a nice demonstration of what QGIS is capable of!
The higher the map resolution, the more viewpoints and the longer the viewing distance the more precise the estimation will be but calculation time increases exponentially.
- Download a Digal Terrain Model (DTM) if available, or convert your lidar data into a DTM using GQIS/PDAL. Depending on the area size, a resolution of 5-25m.
- Load the GPX file.
- Use the Qchainage plugin (from the toolbar) to create a string of points from the GPX. The distance between the points has to be set in an angle: 0,0002 degrees = about 17 meters. If you first export the GPX to a Geopackage file in a projected CRS this interval can be set in meters.
- Toolbox processing > Visibility Analysis > Create viewpoints: choose the points layer created in previous step and the DEM layer, set observer height to 10m (replay cams could be set well above road level, but also the lower the DEM resolution the higher you have to set this) and set Radius of analysis = expected maximum viewing distance.
- Toolbox processing > Visibility Analysis > Viewshed: choose the viewpoints layer from pevious step and the DEM layer. Set “combining multiple outputs” to maximum. (addition wil generate a grescale image).
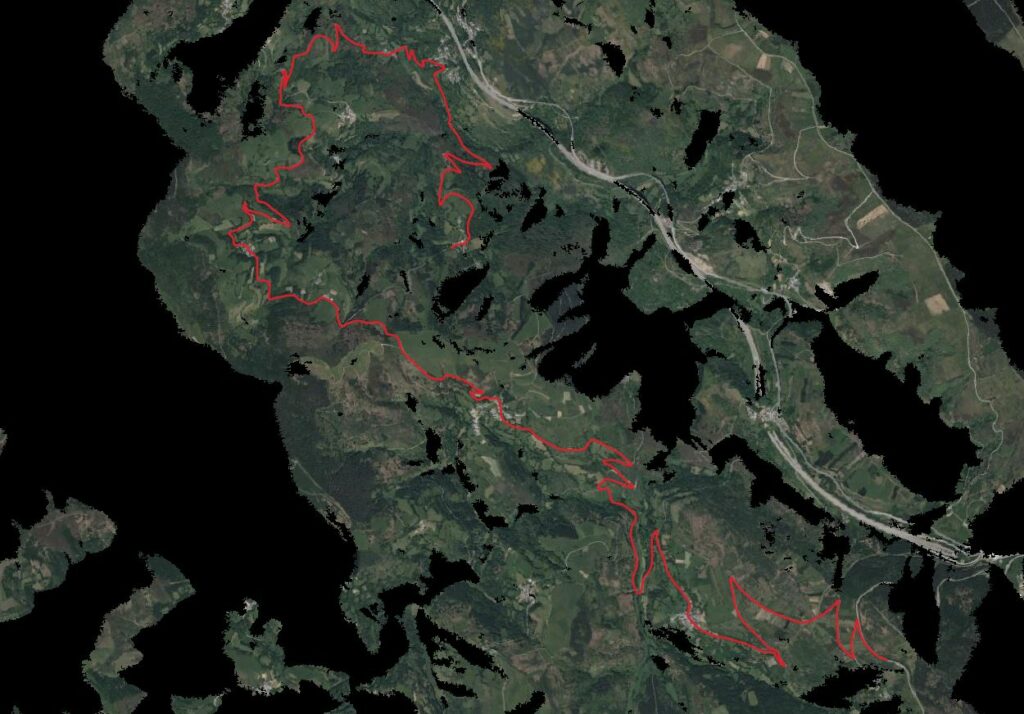
- After processing you’ll see a black/white map; visible areas are white. To set this as a mask over satellite imagery, where invisible areas are blacked out: right-click on the newly generated layer > Transparency: Custom Transparency Options > add a line: From 1 to 1 = 100 percent transparent. To make the black slightly transparent: add another line: From 0 to 0 = 25 percent transparent
A few extra tips:
- A DTM may contain multiple bands (like layers); use the IDW or the mean band.
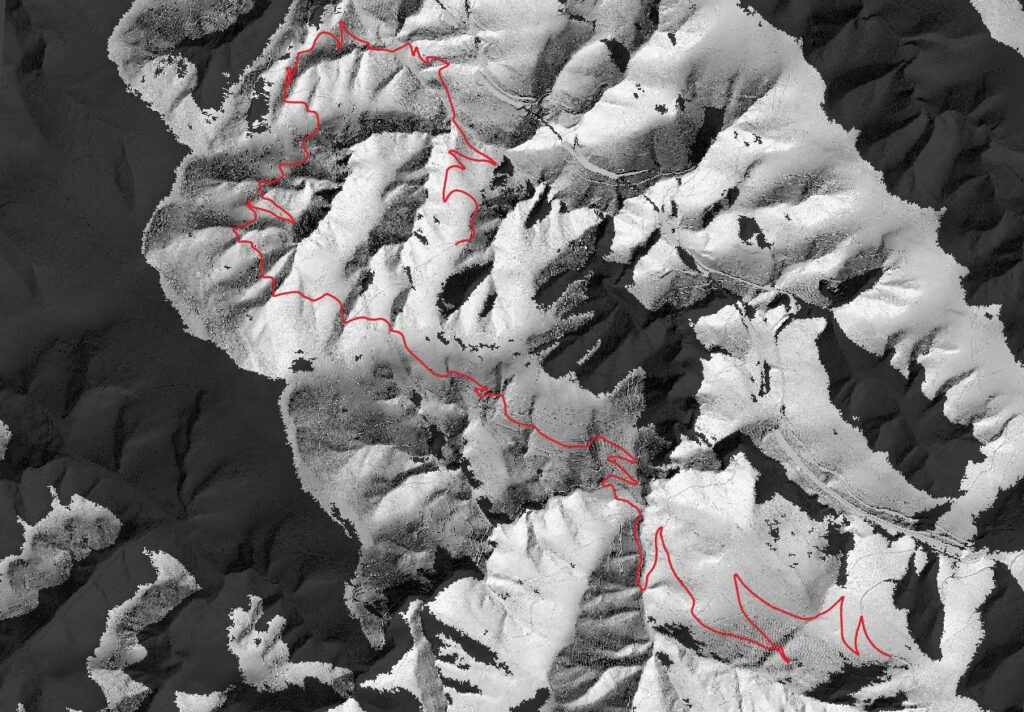
- Using Raster >Analysis > Hillshade you can convert the DTM into a pseudo 3D view
- Small spots can be removed using the Sieve tool (under Raster > Anaysis). It may be necesarry to first save the image as ‘rendered’, and if you get weird errors, try reprojecting into another CRS.